
As the latest inflation data shows signs of cooling prices and the Reserve Bank of India (RBI) decides to pause repo rate hikes, investors and market participants are closely monitoring sectors that could potentially benefit from this economic climate. Among the sectors to keep a watchful eye on, Information Technology (IT) stands out as a promising contender.
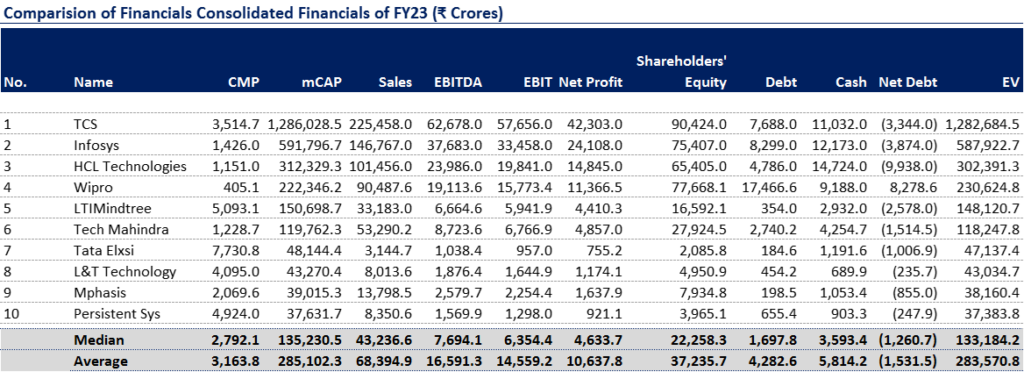
In this blog post, we delve into a comprehensive analysis of the relative valuation of India's top 10 listed companies in the Information Technology sector. By exploring their consolidated financials from FY 23 and comparing key operational performance ratios, we aim to gain valuable insights into the sector's potential.
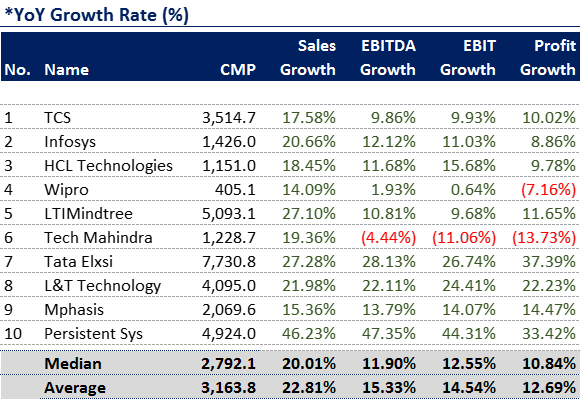
The following table shows the comparative Year on Year (YoY) growth rate in Sales, EBITDA, EBIT and Net Profit.
Next, we will compare the key ratios of these 10 IT giants as mentioned in the below table:

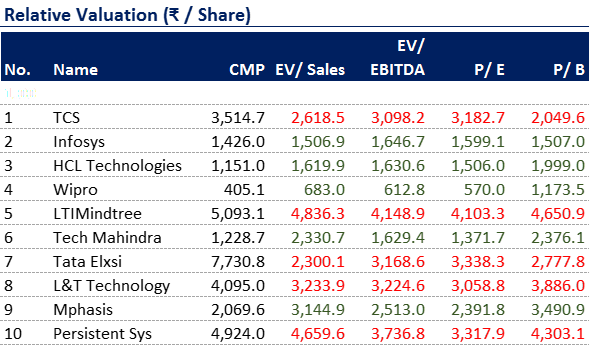
Finally, to gauge the relative value of each company's shares, we consider the implied Enterprise Value (EV) using the following metrics: EV/Sales, EV/EBITDA, P/E (Price-to-Earnings ratio), and P/B (Price-to-Book ratio).
Thus, we get the relative implied value per share for each of the metric as shown in the following table:
In conclusion, this comprehensive analysis offers valuable insights into the relative valuation of India's top 10 IT companies. By comparing their operational performance and relative value per share, investors and enthusiasts alike can make informed decisions in the dynamic world of the IT sector. Remember, it's essential to consider multiple factors and conduct further research before making any investment decisions.
Disclaimer: We are not SEBI registered. All the views are personal and only for educational purposes. Do your due diligence before making any trading or investing decision. The data provided in this blog post is for illustrative purposes only and does not constitute financial advice. Always consult with a qualified financial advisor before making investment decisions.
Read the detailed 'Disclaimer' here